BloomBoard Reports are designed to give you insights and ways to analyze data within a specific program your organization has implemented. Admins can use BloomBoard Reports to see an overview of progress or to discover detailed information as they support educators in their coursework.
Note: You must have an administrator role on BloomBoard to access reports. To view, click on the briefcase icon in the left-side navigation bar.
Learner Overview
The Learner Overview report shows course and unit status data. See at-a-glance progress, or use the filters to view specific details. The Earned Stats column displays earned progress for both active courses and overall degree progress.
Visit Unit Status Definitions for Faculty, Coaches, and District Admins for insight to help you analyze your program data. You’ll want to scroll to the section titled BloomBoard Reports Statuses.
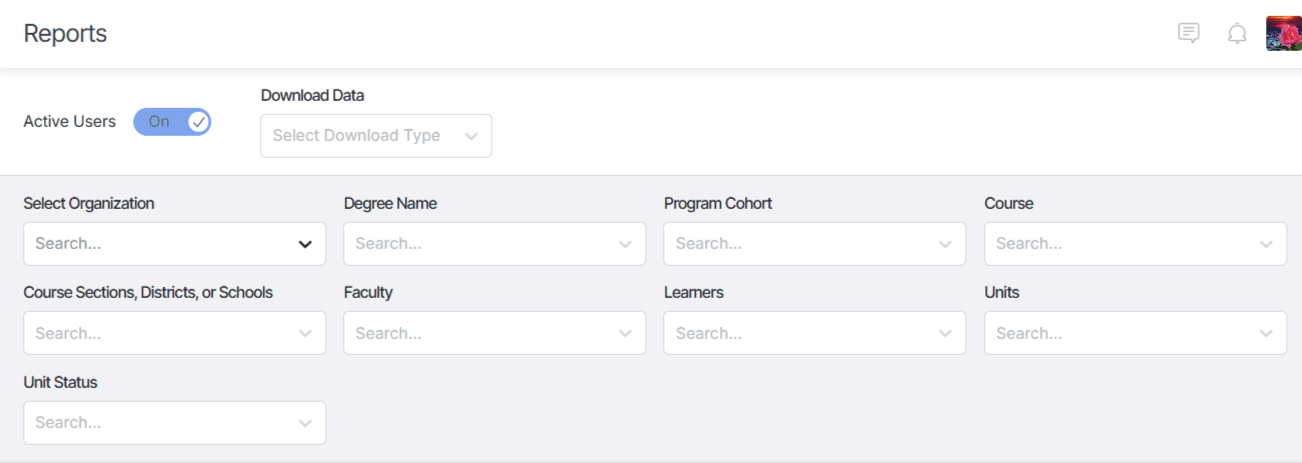
Helpful Hint: Make sure you have the Active Users toggle switched on to view progress for learners who are currently active in the program. For a complete history, you can toggle that switch off to view data for learners who have been deactivated or removed from the program.
Learner Progress
The Learner Progress tab shows the participants' progress in all of their active units.
-
Total Active Units - The number of units actively on the participants' dashboard.
-
Units Earned - Percentage of units Earned out of their current active units.
-
Units In-Progress - Percentage of units that have the In-Progress, Submitted, or Resubmission status out of their current active units.
-
Units Started - Percentage of units that are in Started or Learning status out of their current active units.
- Units Not Started - Percentage of units that the participant has not yet started of their current active units.
Data Table
The Data Table provides a detailed view of individual learners' progress on units within a course or program. You can choose which data to view by enabling specific data selectors from the Manage Columns option, or you can choose to Restore Default Columns. Data in each data column can also be easily searched.
Click the Manage Columns option and select the data that you'd like to appear in the table.
You can then view the selected data in the table.
Clicking on a column header also allows the column to be sorted in ascending or descending order.
Course Progress
This tab provides an aggregate view of unit activity in a program. The data can be filtered in many ways, including by course, course section, district, or school, as well as by learner name, submission status, and unit name.
Hovering over the chart will provide a pop-up with more detailed information.
Downloading Reports
Reports can be downloaded in the following types:
- Learner Progress
- Data Table
- Data Table Selection (Only downloads the data from your currently selected filters)
- Program Requirement Files (Downloads a blank file if your district does not use these files)
Helpful Hint- Toggle Active Users to On to download active user data only or to Off for inactive user data.